Why WBS is the Key to Project Success

Stop guessing. Start predicting. Transform chaos into clarity with Work Breakdown Structure.

Are You Facing These Project Management Challenges?

📊

"I can't predict when the project will finish"

Vague estimates lead to missed deadlines and disappointed stakeholders

🔄

"Schedules keep slipping and I don't know why"

Without visibility into bottlenecks, you're always playing catch-up

😰

"Team workload feels imbalanced"

Some team members are overloaded while others have spare capacity

🎯

"Hard to see the big picture at a glance"

Scattered information makes it difficult to track overall progress

💸

"Project costs keep exceeding budget"

Without granular tracking, budget overruns become inevitable

The root cause? Lack of systematic work breakdown and tracking.

What is WBS (Work Breakdown Structure)?

WBS is a proven methodology for systematically breaking down projects into manageable units. Used by NASA, the Department of Defense, and global IT companies for decades.

Core Principle of WBS

Project
  ├─ Major Feature A
  │   ├─ Task A-1 (estimated time, assignee, priority)
  │   ├─ Task A-2
  │   └─ Task A-3
  ├─ Major Feature B
  │   ├─ Task B-1
  │   └─ Task B-2
  └─ Major Feature C
          

Break large projects into measurable and manageable small tasks, precisely tracking time and resources for each.

How WBS Transforms Your Projects

🎯

1. Accurate Schedule Prediction

Before WBS

  • "Roughly 3 months?"
  • Vague estimates
  • Unclear delay causes

With WBS

  • "Exactly 87 days to completion"
  • Data-driven predictions
  • Instant bottleneck identification

Real Example: 1,800-hour project broken into 60 tasks, real-time progress tracking, accurate completion prediction with burndown charts.

Project timeline prediction burndown chart - actual progress vs. ideal line with predicted completion date
📊

2. Visualized Progress

See all task statuses at a glance:

  • ✅ Completed: 38 tasks (63%)
  • 🔄 In Progress: 10 tasks (17%)
  • 📋 Planned: 11 tasks (18%)
  • ⏸️ On Hold: 2 tasks (2%)

No more wasting time answering. How's the project going?"

Project management software statistics dashboard - task distribution by status with percentage charts
⚖️

3. Balanced Resource Distribution

Monitor team workload in real-time:

  • Thomas: 600 hours (33%) - Normal range
  • Raymond: 600 hours (33%) - Normal range
  • Jason: 300 hours (17%) - Can take more work

Prevent workload concentration and predict resource shortages in advance.

Resource calendar-based timeline prediction - team member workload distribution with color-coded capacity levels
🎲

4. Early Risk Detection

  • Resource Shortage: Automatic warning when required time > available time
  • Bottleneck Identification: Instantly see which tasks delay the entire schedule
  • Priority Optimization: Adjust task order based on importance and dependencies
💰

5. Cost Control

Estimated Cost = Total Estimated Hours × Hourly Rate

Actual Cost = Actual Hours × Hourly Rate

Remaining Cost = Remaining Hours × Hourly Rate

Track costs in real-time during project execution and prevent budget overruns.

Plexo: Making WBS Easy and Powerful

"Excel's Precision + Kanban's Intuitiveness + Real-time Collaboration"

🎨 1. Kanban Board: Easy Management with Drag & Drop

Instead of complex formulas and cell editing, manage with an intuitive kanban board.

📋 To Do

Task A
30h remaining | P1 🔴
Task B

🔄 In Progress

Task D
10/30h | P2 🟡
Task E

✅ Done

Task G
30/30h | P1 🔴
Task H
  • Drag to change status: Automatically update progress when moving tasks
  • Real-time reflection: Team changes instantly visible on your screen
  • Priority display: Color-coded urgency (P1: 🔴, P2: 🟡, P3: 🟢)
Project management software Kanban board - drag-and-drop task movement between columns

📈 2. Statistics Dashboard: Data-Driven Decisions

Per-Assignee Statistics

  • View each team member's workload, progress, and capacity at a glance
  • Instantly detect resource shortages (-130 hours)
  • Accurately determine when to add more resources

Priority/Difficulty/Status Statistics

  • Focus management on high-priority tasks
  • Monitor progress of difficult tasks
  • Immediately identify bottlenecks
Project timeline prediction statistics dashboard - assignee workload, status distribution, and priority breakdown charts

📅 3. Resource Calendar: Complete Workforce Planning

Assignee Mon Tue Wed Thu Fri Sat Sun Total Spare
Thomas 8h 8h 8h 8h 8h 0 0 800h 0h
Raymond 0 4h 8h 8h 0 0 0 788h 0h
Jason 0 0 0 0 4h 0 0 403h 0h
  • Daily workload visualization: Clearly show who does what and when
  • Holiday management: Synced with organization calendar to calculate actual work hours
  • Overtime prevention: Automatic warning when exceeding standard daily hours (8h)
Resource calendar-based timeline prediction - weekly workload distribution per team member

🔥 4. Burndown Chart: Precise Completion Prediction

Visualize remaining work and predict completion date based on current velocity.

  • Real-time prediction: Automatically calculate completion date at current pace
  • Trend analysis: Detect slowdowns immediately and respond
  • Milestone management: Clearly mark critical dates
Project timeline prediction burndown chart - ideal line, actual progress, and predicted completion date marker

📦 5. Hierarchical Categories: Organize Large Projects

Project
├─ Test (17 tasks)
│   └─ Smoke Test (11 tasks)
├─ Deploy (16 tasks)
├─ Security (9 tasks)
│   └─ Authentication (7 tasks)
└─ ...
          
  • 2-level categories: Logically structure large projects
  • Per-category statistics: Track progress of each area independently
  • Flexible structure: Freely organize according to project characteristics
Real-time collaborative WBS category tree - collapsible hierarchy and task counts

💾 6. Data Portability: Import/Export

Import

  • From Excel (.xlsx) or CSV
  • Reuse existing WBS files
  • Start projects quickly with templates

Export

  • Backup to Excel or CSV
  • Integrate data with external systems
  • Extract data for reports
Import Tasks wizard - column mapping interface for Excel and CSV file import

🔄 7. Real-time Collaboration: Stop Emailing Excel Files

YJS-based Simultaneous Editing

  • Multiple people edit simultaneously like Google Docs
  • Changes instantly reflected to all team members
  • Automatic merge without conflicts
  • Automated version control

Real-time Display of Who's Doing What

  • Show currently connected team members
  • See who's editing which task
  • Share cursor positions in real-time
Real-time collaborative project management software task showing multiple user avatars indicating who's viewing/editing

Real-World Scenarios

Scenario 1: Starting a New Project

Traditional Way (3-5 days)

  1. Find Excel template
  2. Design project structure
  3. Write task list
  4. Assign team members
  5. Estimate time
  6. Set up formulas
  7. Share file with team

Plexo Way (30 minutes)

  1. Create project
  2. Set up category structure
  3. Add tasks (or import template)
  4. Drag to assign team members
  5. Automatic calculation starts
  6. Share link to start collaboration

Scenario 2: Daily Stand-up Meeting

Traditional Way

  • Everyone opens their own Excel file
  • Verbal progress reports
  • Manual note-taking
  • Update Excel after meeting
  • Re-share files

Plexo Way

  • Share dashboard screen
  • See everything at a glance with real-time stats
  • "Jason has spare capacity today. Can you take one more urgent task?"
  • "Raymond is overloaded. Thomas, can you help?"
  • Adjust immediately on kanban board
  • All changes auto-saved and shared

Scenario 3: Weekly Review and Planning

Preparation Time

Traditional: 2-3 hours (data cleanup, chart creation)

Plexo: 0 minutes (always up-to-date)

Review Content

  • This week completed: 15 tasks (100% of goal)
  • In progress: 8 tasks
  • Resource utilization: 94%
  • Expected completion: 3 days ahead of target ✅

How Plexo Compares

상세 비교는 Why Plexo 페이지에서 확인하세요.

Who Should Use Plexo?

✅ Project Managers

  • Managing multiple projects simultaneously
  • Need accurate schedule predictions
  • Want to identify risks early

✅ Development Team Leaders

  • Track sprint planning and actual progress
  • Maintain balanced team workload
  • Visualize progress with burndown charts

✅ Small Teams / Startups

  • Want to start quickly
  • Complex tools are overwhelming
  • Need cost-effective solutions

✅ Freelancers / Consultants

  • Manage multiple client projects simultaneously
  • Accurate effort estimation and billing
  • Transparent progress sharing

✅ Enterprise PMO

  • Project portfolio management
  • Standardized project management process
  • Executive dashboards

❌ May Not Be Ideal If::

  • Only need a simple to-do list → Recommend simpler tools
  • Enterprise-grade complex workflows → Recommend Jira
  • Knowledge management focused → Recommend Notion

Real Customer Success Stories

Case 1: Software Development Company (5-person team)

Before

  • Managing WBS with Excel
  • Weekly file exchanges causing confusion
  • Inaccurate schedule predictions (±30% error)
  • Frequent resource imbalances

After

  • Real-time collaboration eliminated confusion
  • Schedule prediction error within ±5%
  • Resource utilization improved from 85% to 95%
  • Increased project success rate

Case 2: Digital Agency (Multiple projects)

Before

  • Separate Excel management per client
  • Difficult to grasp team member workload
  • Frequent deadline delays

After

  • Portfolio view shows all projects at a glance
  • Real-time check of team member availability
  • Accurate staffing plan for new projects
  • Improved client satisfaction

Get Started Now

🚀 Free Trial

Start instantly without credit card

  • 14-day free trial
  • Unlimited access to all features
  • Invite team members
  • Cancel anytime
Try Professional Free

📦 Simple Getting Started

  1. Sign up (30 seconds) - Email and org name only
  2. Create project (1 minute) - Set name and schedule
  3. Add tasks (5 minutes) - Enter directly or import from Excel
  4. Invite team (1 minute) - Send invitation link via email

In 5 minutes, you'll already be using Plexo.

Start for Free

💡 What You Need

✅ Required

  • Internet connection
  • Web browser (Chrome, Firefox, Safari, Edge)

❌ Not Required

  • Installation software
  • Special technical knowledge

Frequently Asked Questions

Q: We're fine with Excel. Why switch?

A: Excel is also a great tool. However:

  • If you need real-time collaboration
  • If you need automatic calculations and visualizations
  • If version control is causing confusion
  • If team members aren't familiar with Excel

Plexo is the better choice. Plus, you can import your existing Excel files directly.

Q: Can we use it if team members don't know WBS?

A: Absolutely! Plexo hides WBS complexity and provides only an intuitive interface.

  • Kanban board is easy for anyone to understand
  • Simple drag and drop operations
  • No need to understand complex formulas or concepts

Q: Is it suitable for small projects?

A: Yes! Works regardless of project size.

  • 5 tasks? OK
  • 500 tasks? OK
  • Solo use? OK
  • 50-person team? OK

Q: Is the data secure?

A:

  • AWS cloud-based infrastructure
  • Regular automatic backups
  • Export to Excel anytime
  • HTTPS encrypted communication

Q: Can I use it on mobile?

A: Yes, responsive web design works on mobile browsers. (Native app coming soon)

Q: What's the pricing?

A:

  • FREE: Up to 3 projects, 3 team members
  • PROFESSIONAL: $29/month - Unlimited
  • ENTERPRISE: Custom pricing - Advanced features

View Detailed Pricing

Project Success Starts with Preparation

70% of project failures are due to unclear scope, inaccurate estimates, and inefficient resource management.

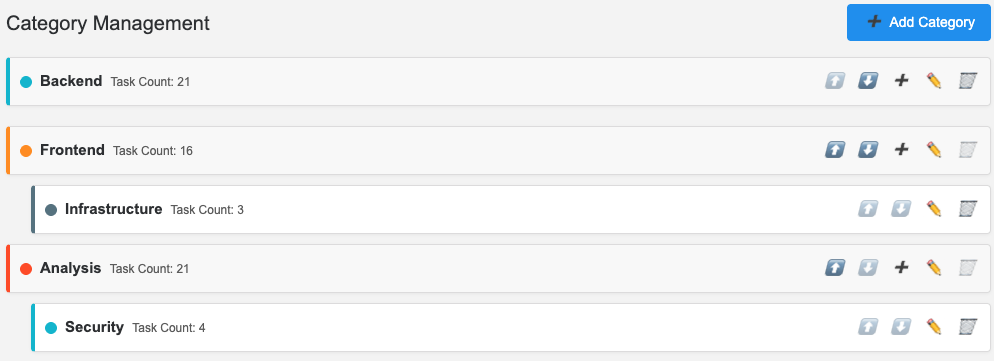
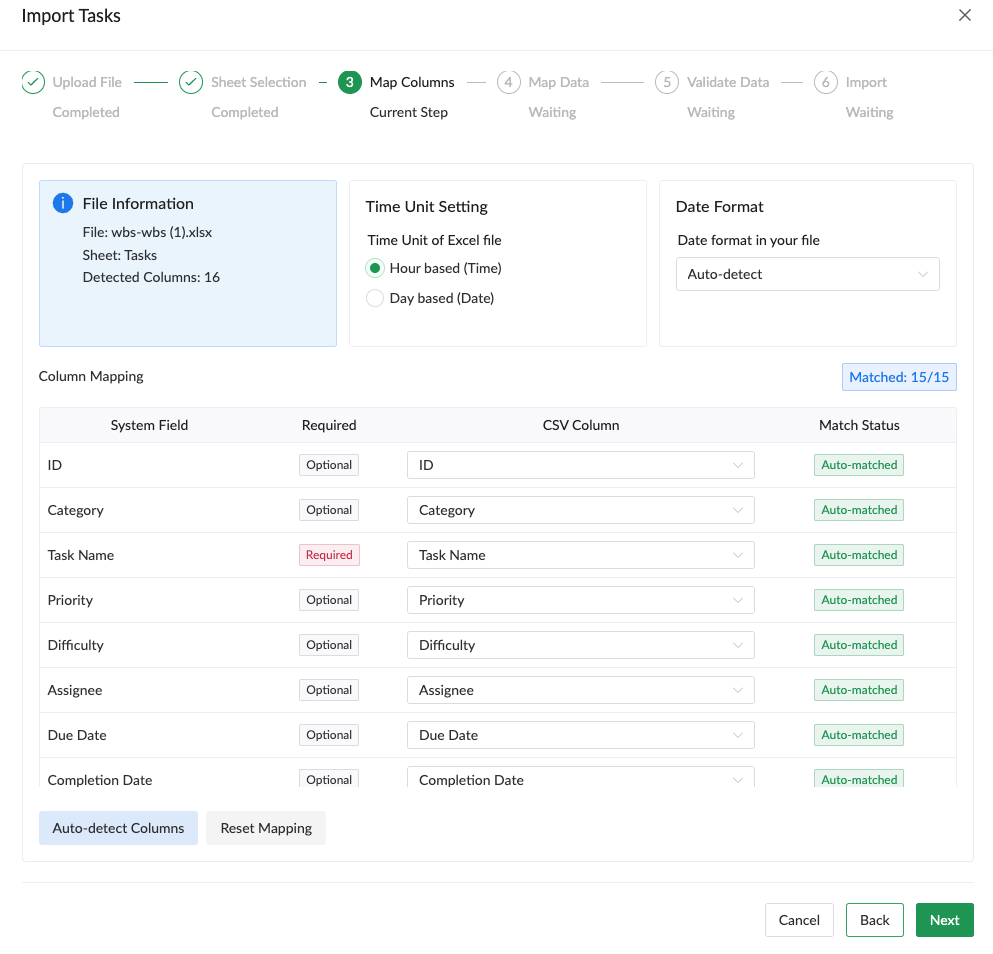
WBS is the proven methodology that solves all these problems, and Plexo makes WBS the easiest and most efficient to use.

Today's Choice Creates Tomorrow's Success

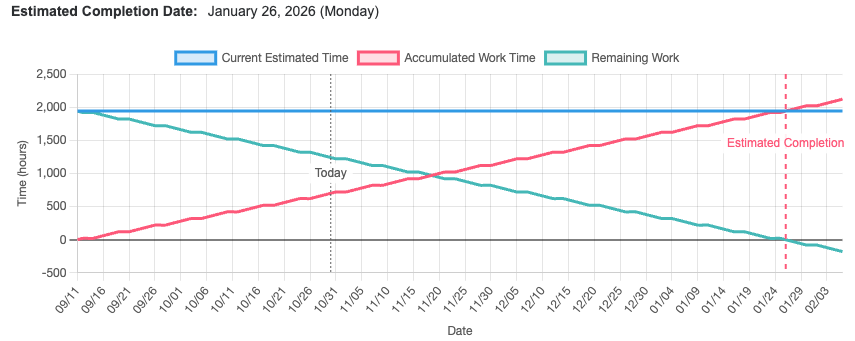
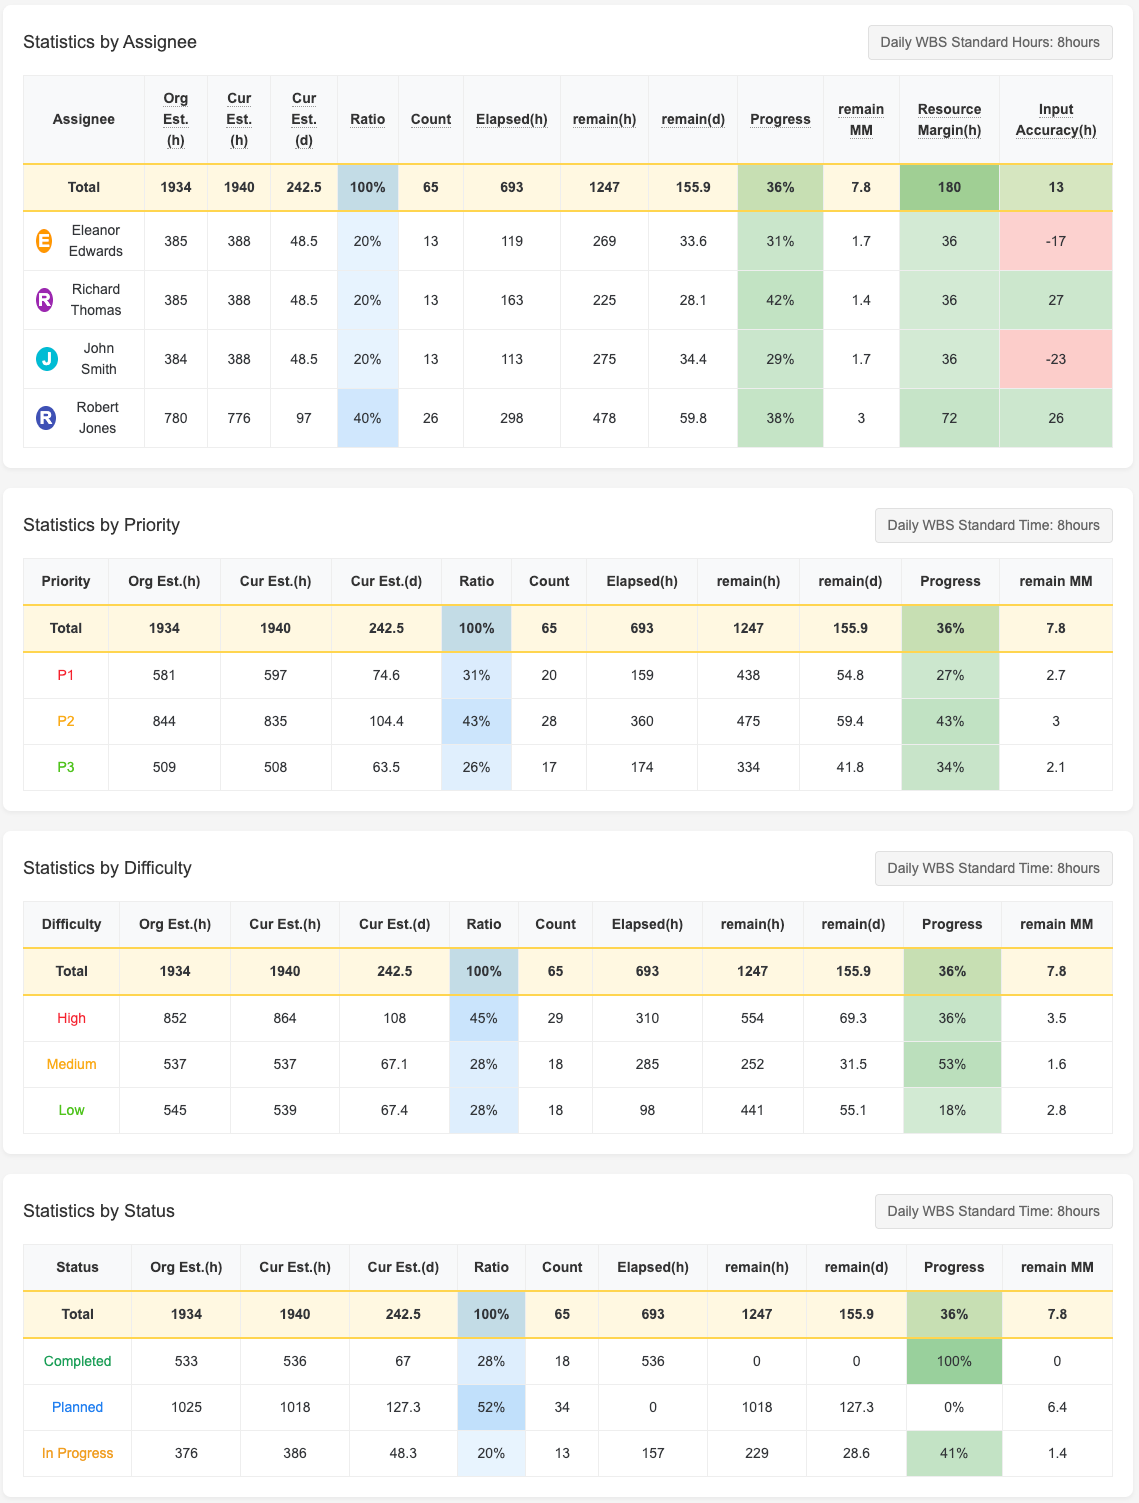
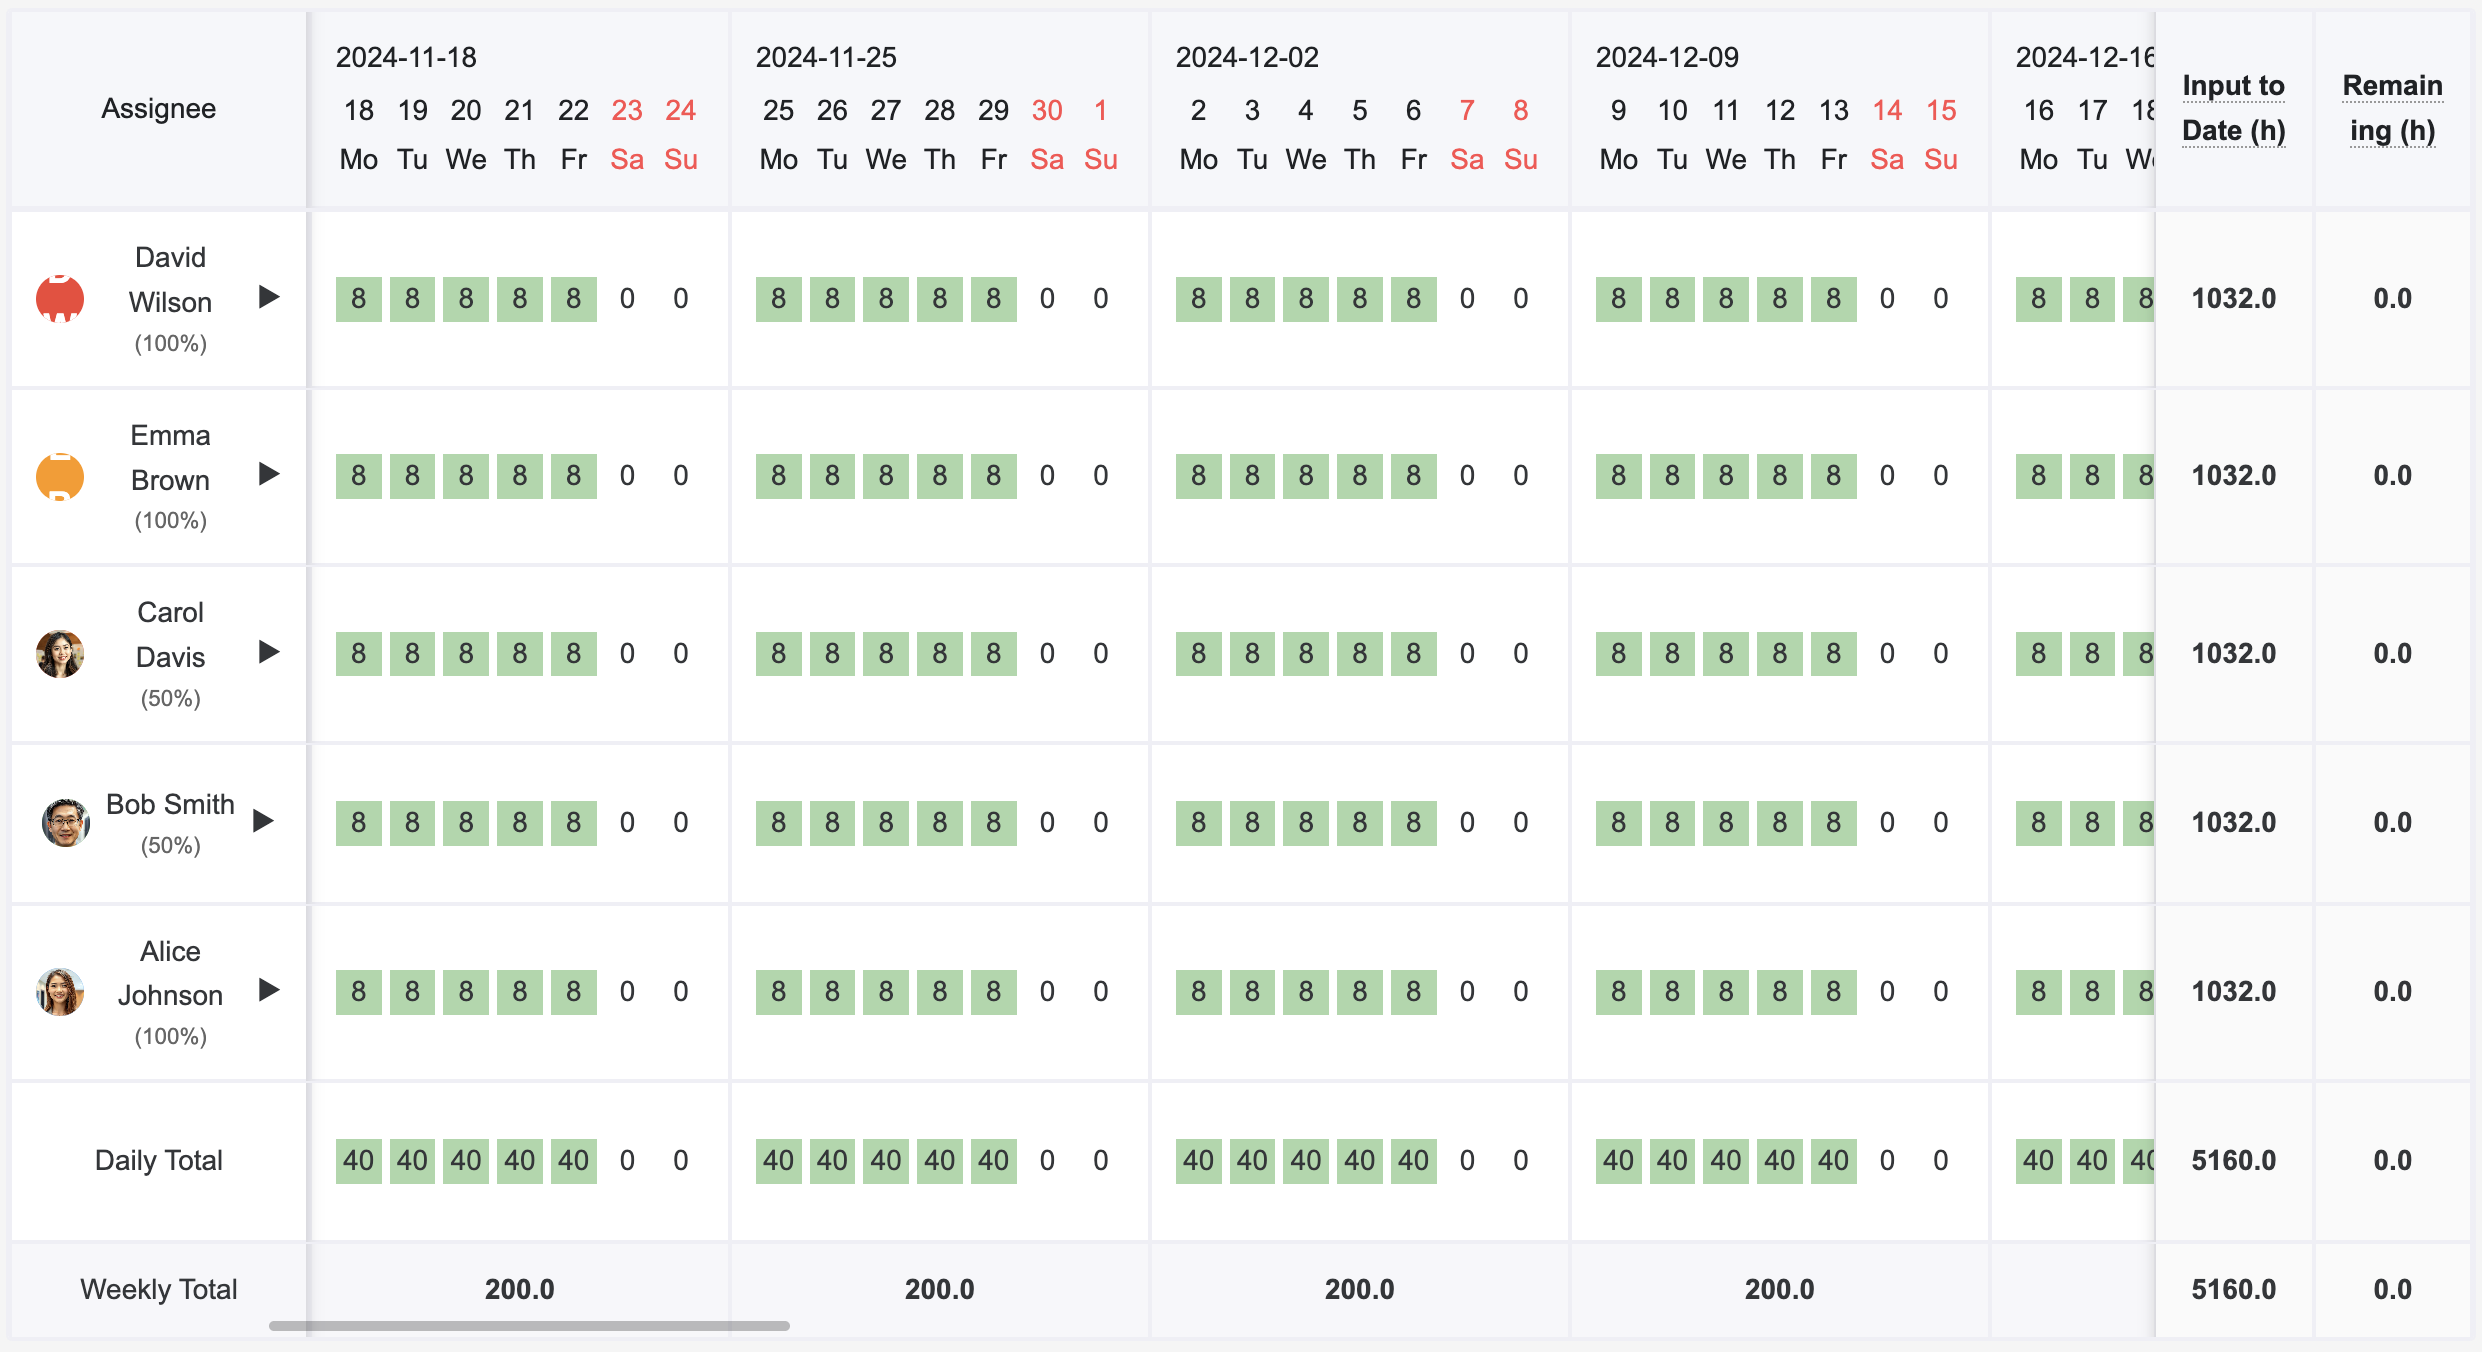
  • ✅ Accurate schedule predictions
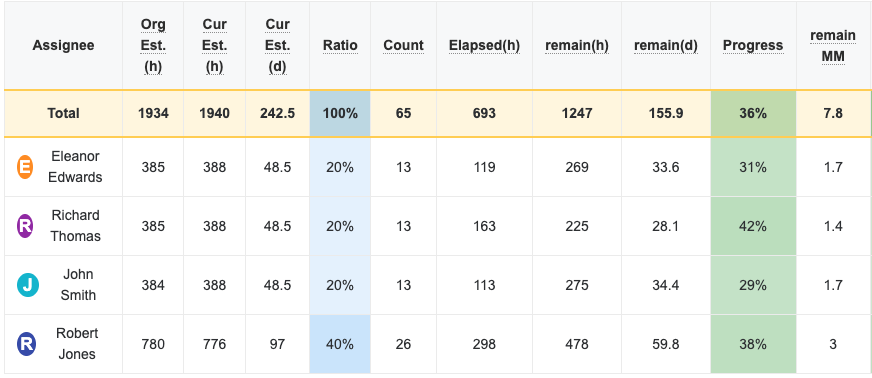
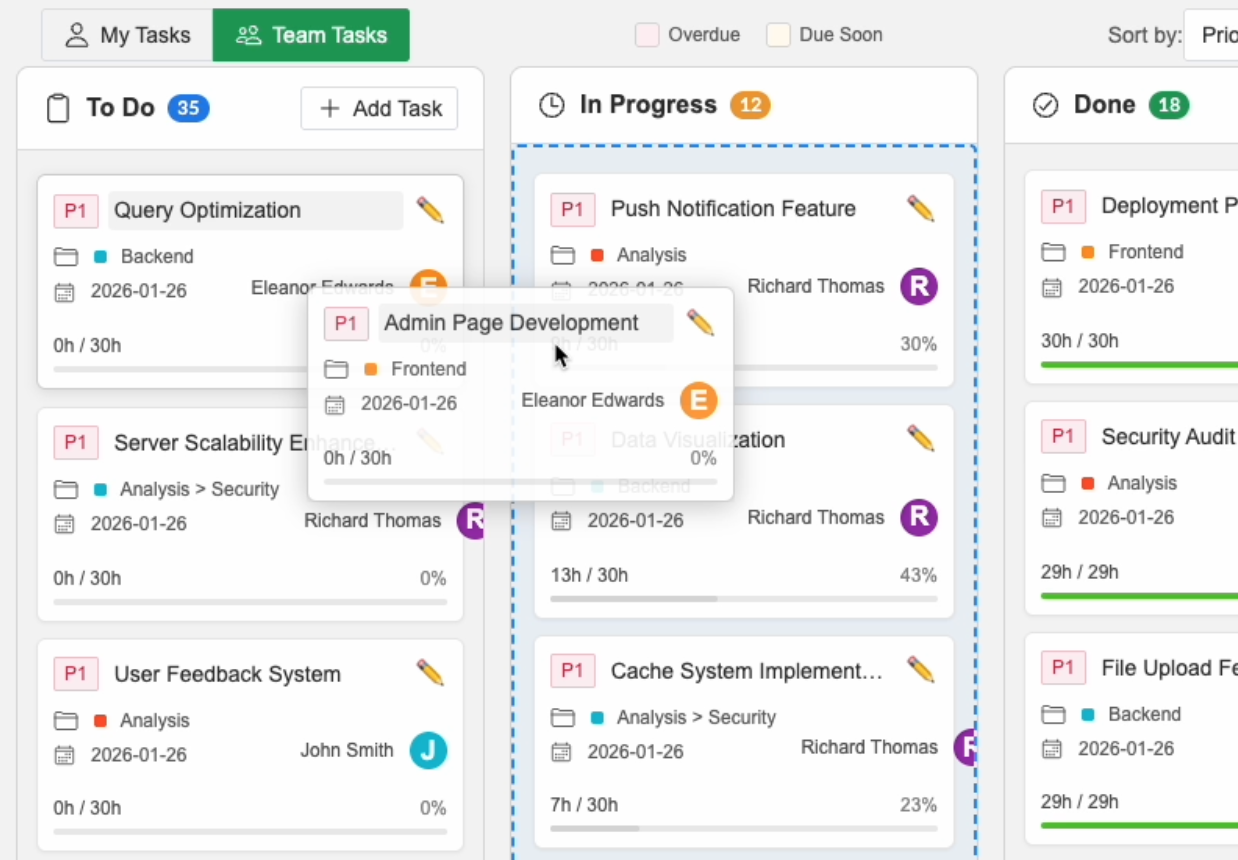
  • ✅ Transparent progress tracking
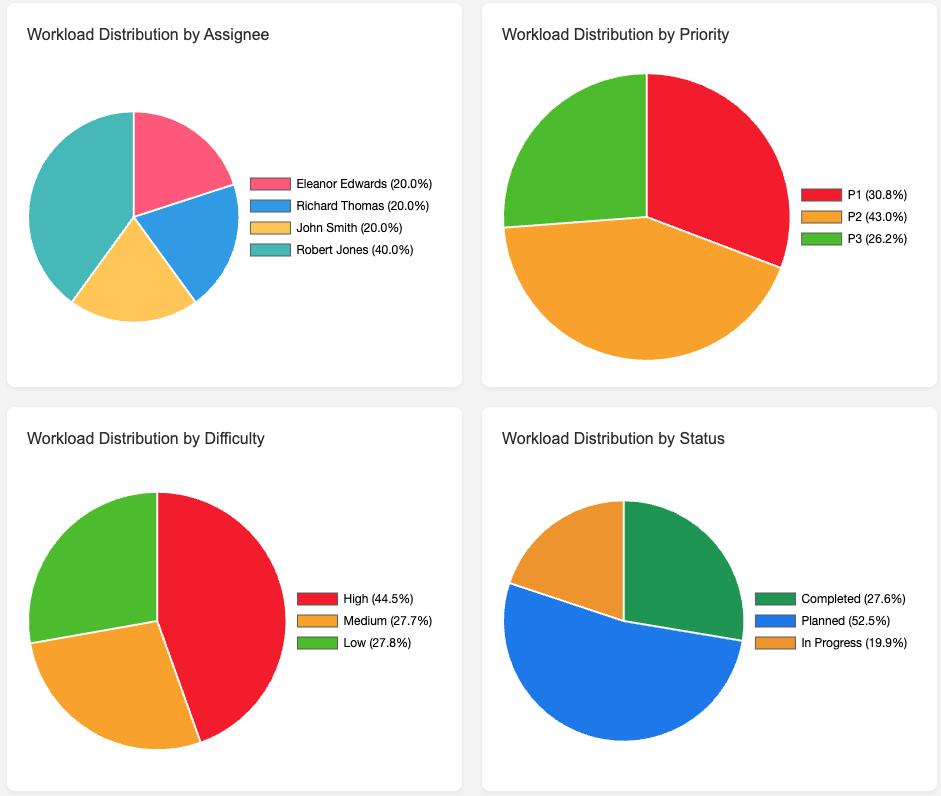
  • ✅ Balanced resource management
  • ✅ Real-time team collaboration
  • ✅ Data-driven decision making

No credit card required | Cancel anytime | 14-day trial